When you head to the menu point ‘Reports’ in the main menu on the top, 'Performance' can be found in the last tab. ‘Performance’ provides you with various possibilities to get an overview of the performance of your team, group, or company by using a wide range of performance indicators.
Read about the other two tabs here -‘Lead insights’ and ‘Case insights’.
Selecting and managing indicator sets
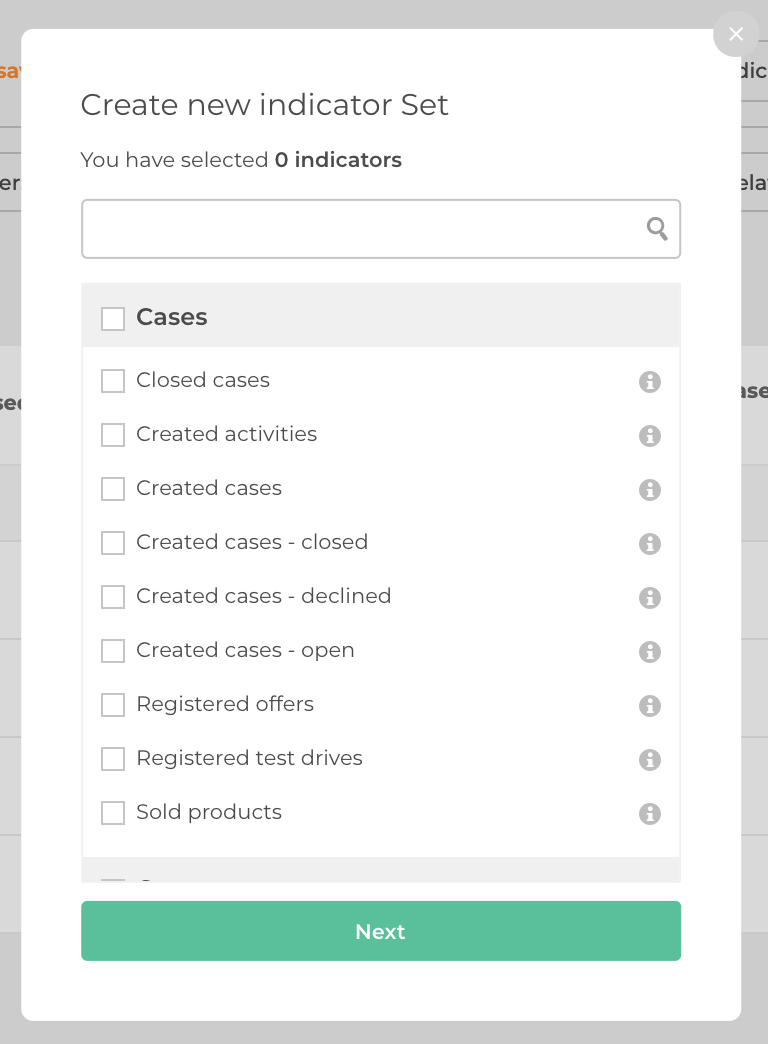
You decide which information to be shown by using ‘Indicator sets’. You can select any number of performance indicators - the combination of which will be called an ‘Indicator set’. Indicator sets are also needed for scheduled reports.
Creating a new Indicator set:
- Click the button ‘New’ in the top right corner.
- Select any number of performance indicators. To find more information about the calculation rules behind each indicator, hover over the 'i' icon or click here.

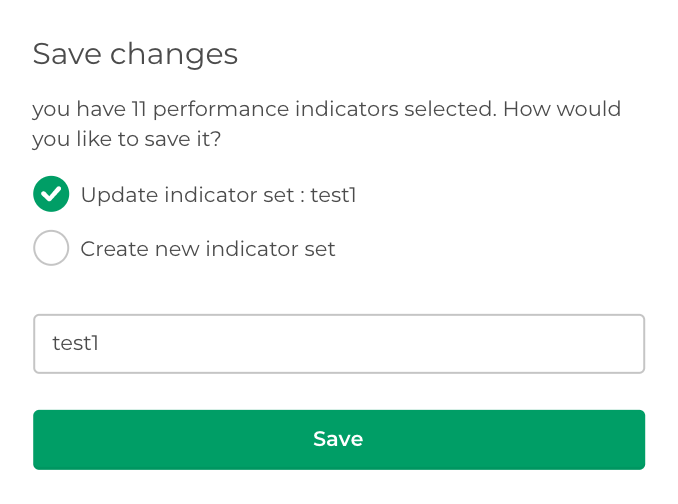
Saving an indicator set:
- Click 'Select indicators' and select all the indicators you wish to be part of your new indicator set.
- Click 'Save' to save changes to the existing indicator set or to create a new set.


Filtering the results
For admins:
- You can filter the indicators by "Period", "Team", "Lead type", "Lead source", "Relations path", and "Product".
- The result can then be downloaded by clicking ‘Download Excel sheet’. (Because of the potential size of the data that the admin can filter for, there is no direct display of the results.)
For team admins:
- You can filter the indicators by "Period", "User", "Lead type", "Lead source", "Relations path", and "Product".
- The result is then displayed for all selected users and teams (for team admins), as well as groups (for group admins) in table format.
- If there are targets set for a team or user for one of the selected indicators, then those targets are shown here as well.
- If you have many indicators selected, there will be scrollbars to move in the table.
- In the bottom right corner you will find a button to download the data as Excel-sheet.
Click here, to find the related video.