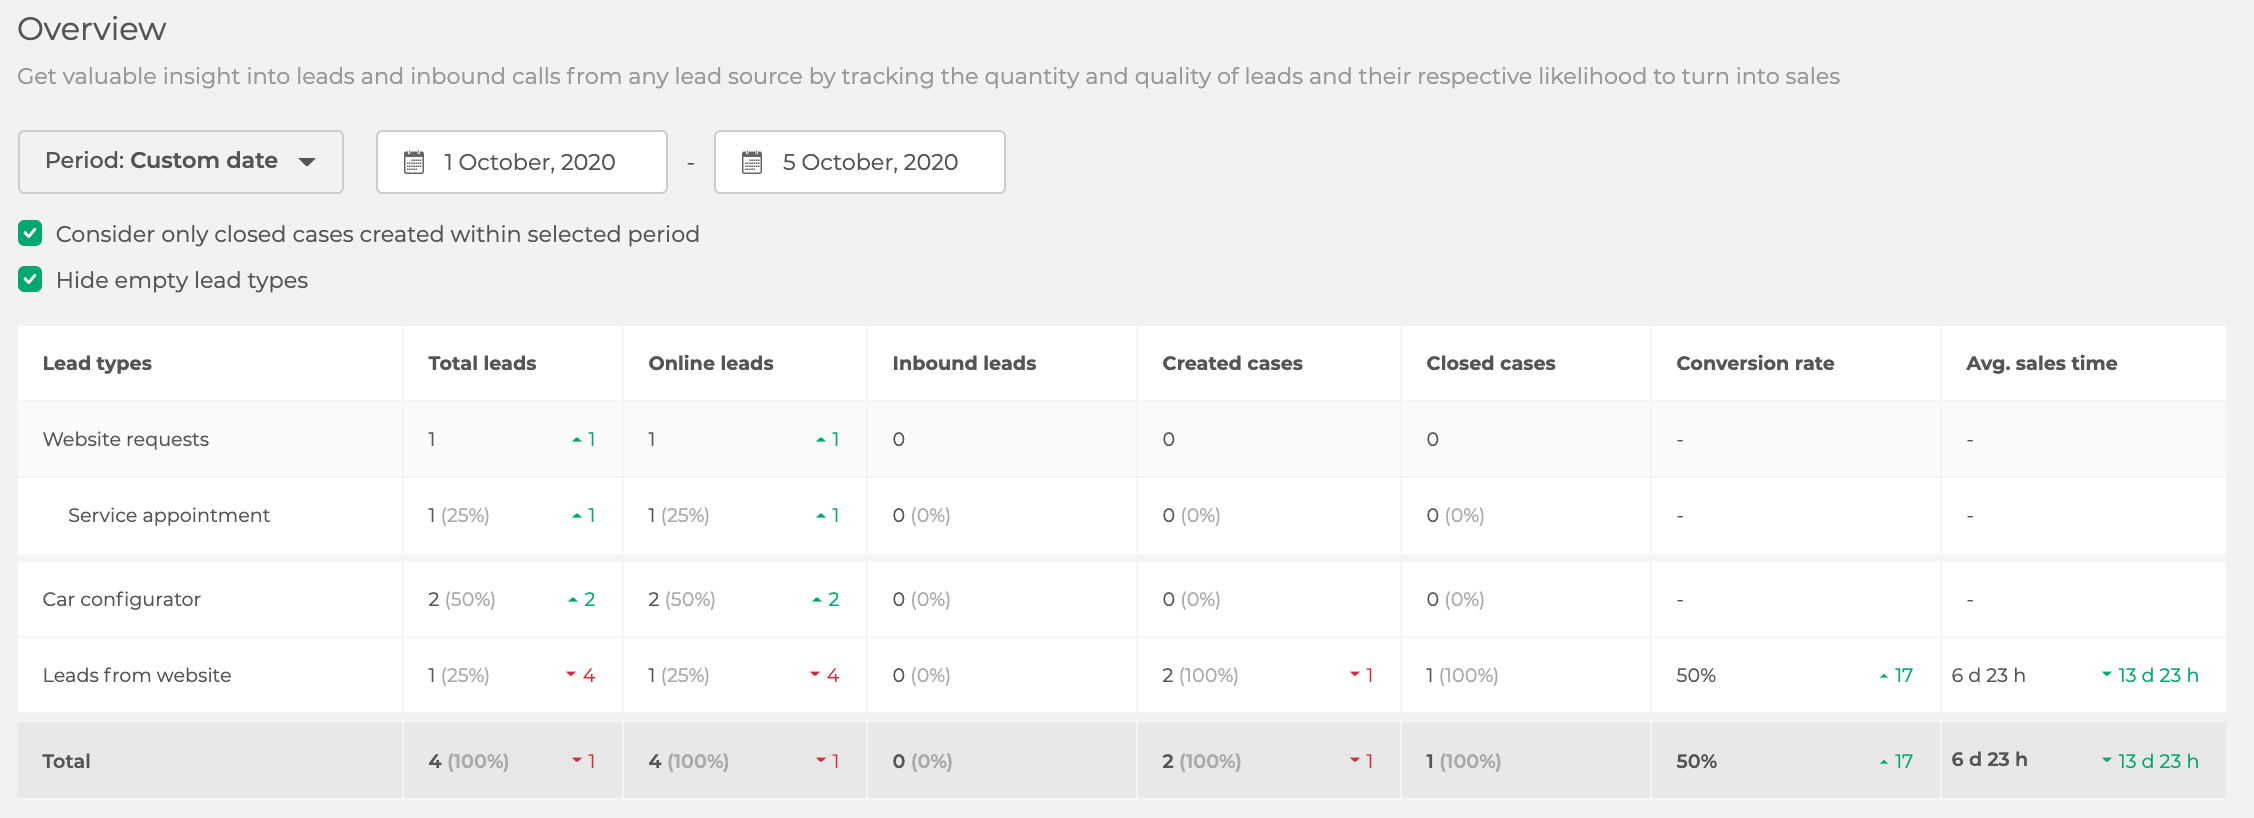
The reports overview shows you the most important numbers at a glance.
You can compare all your lead types, including inbound calls, and see for example how many cases per lead type were closed, the conversion rate and the average sales time.
Not only can you see those numbers, but you can also easily compare them with another time period.
You can compare the current week, month, quarter or year with the previous or any other week, month, quarter or year. Alternatively, you can let the report show a custom time frame.
You can choose if closed cases that were created before the selected time period should be included or not. And you can hide empty lead types, so that you will only see what is relevant to you.

This gives you the possibility to easily recognise your most successful lead types, so that you can act and plan accordingly.
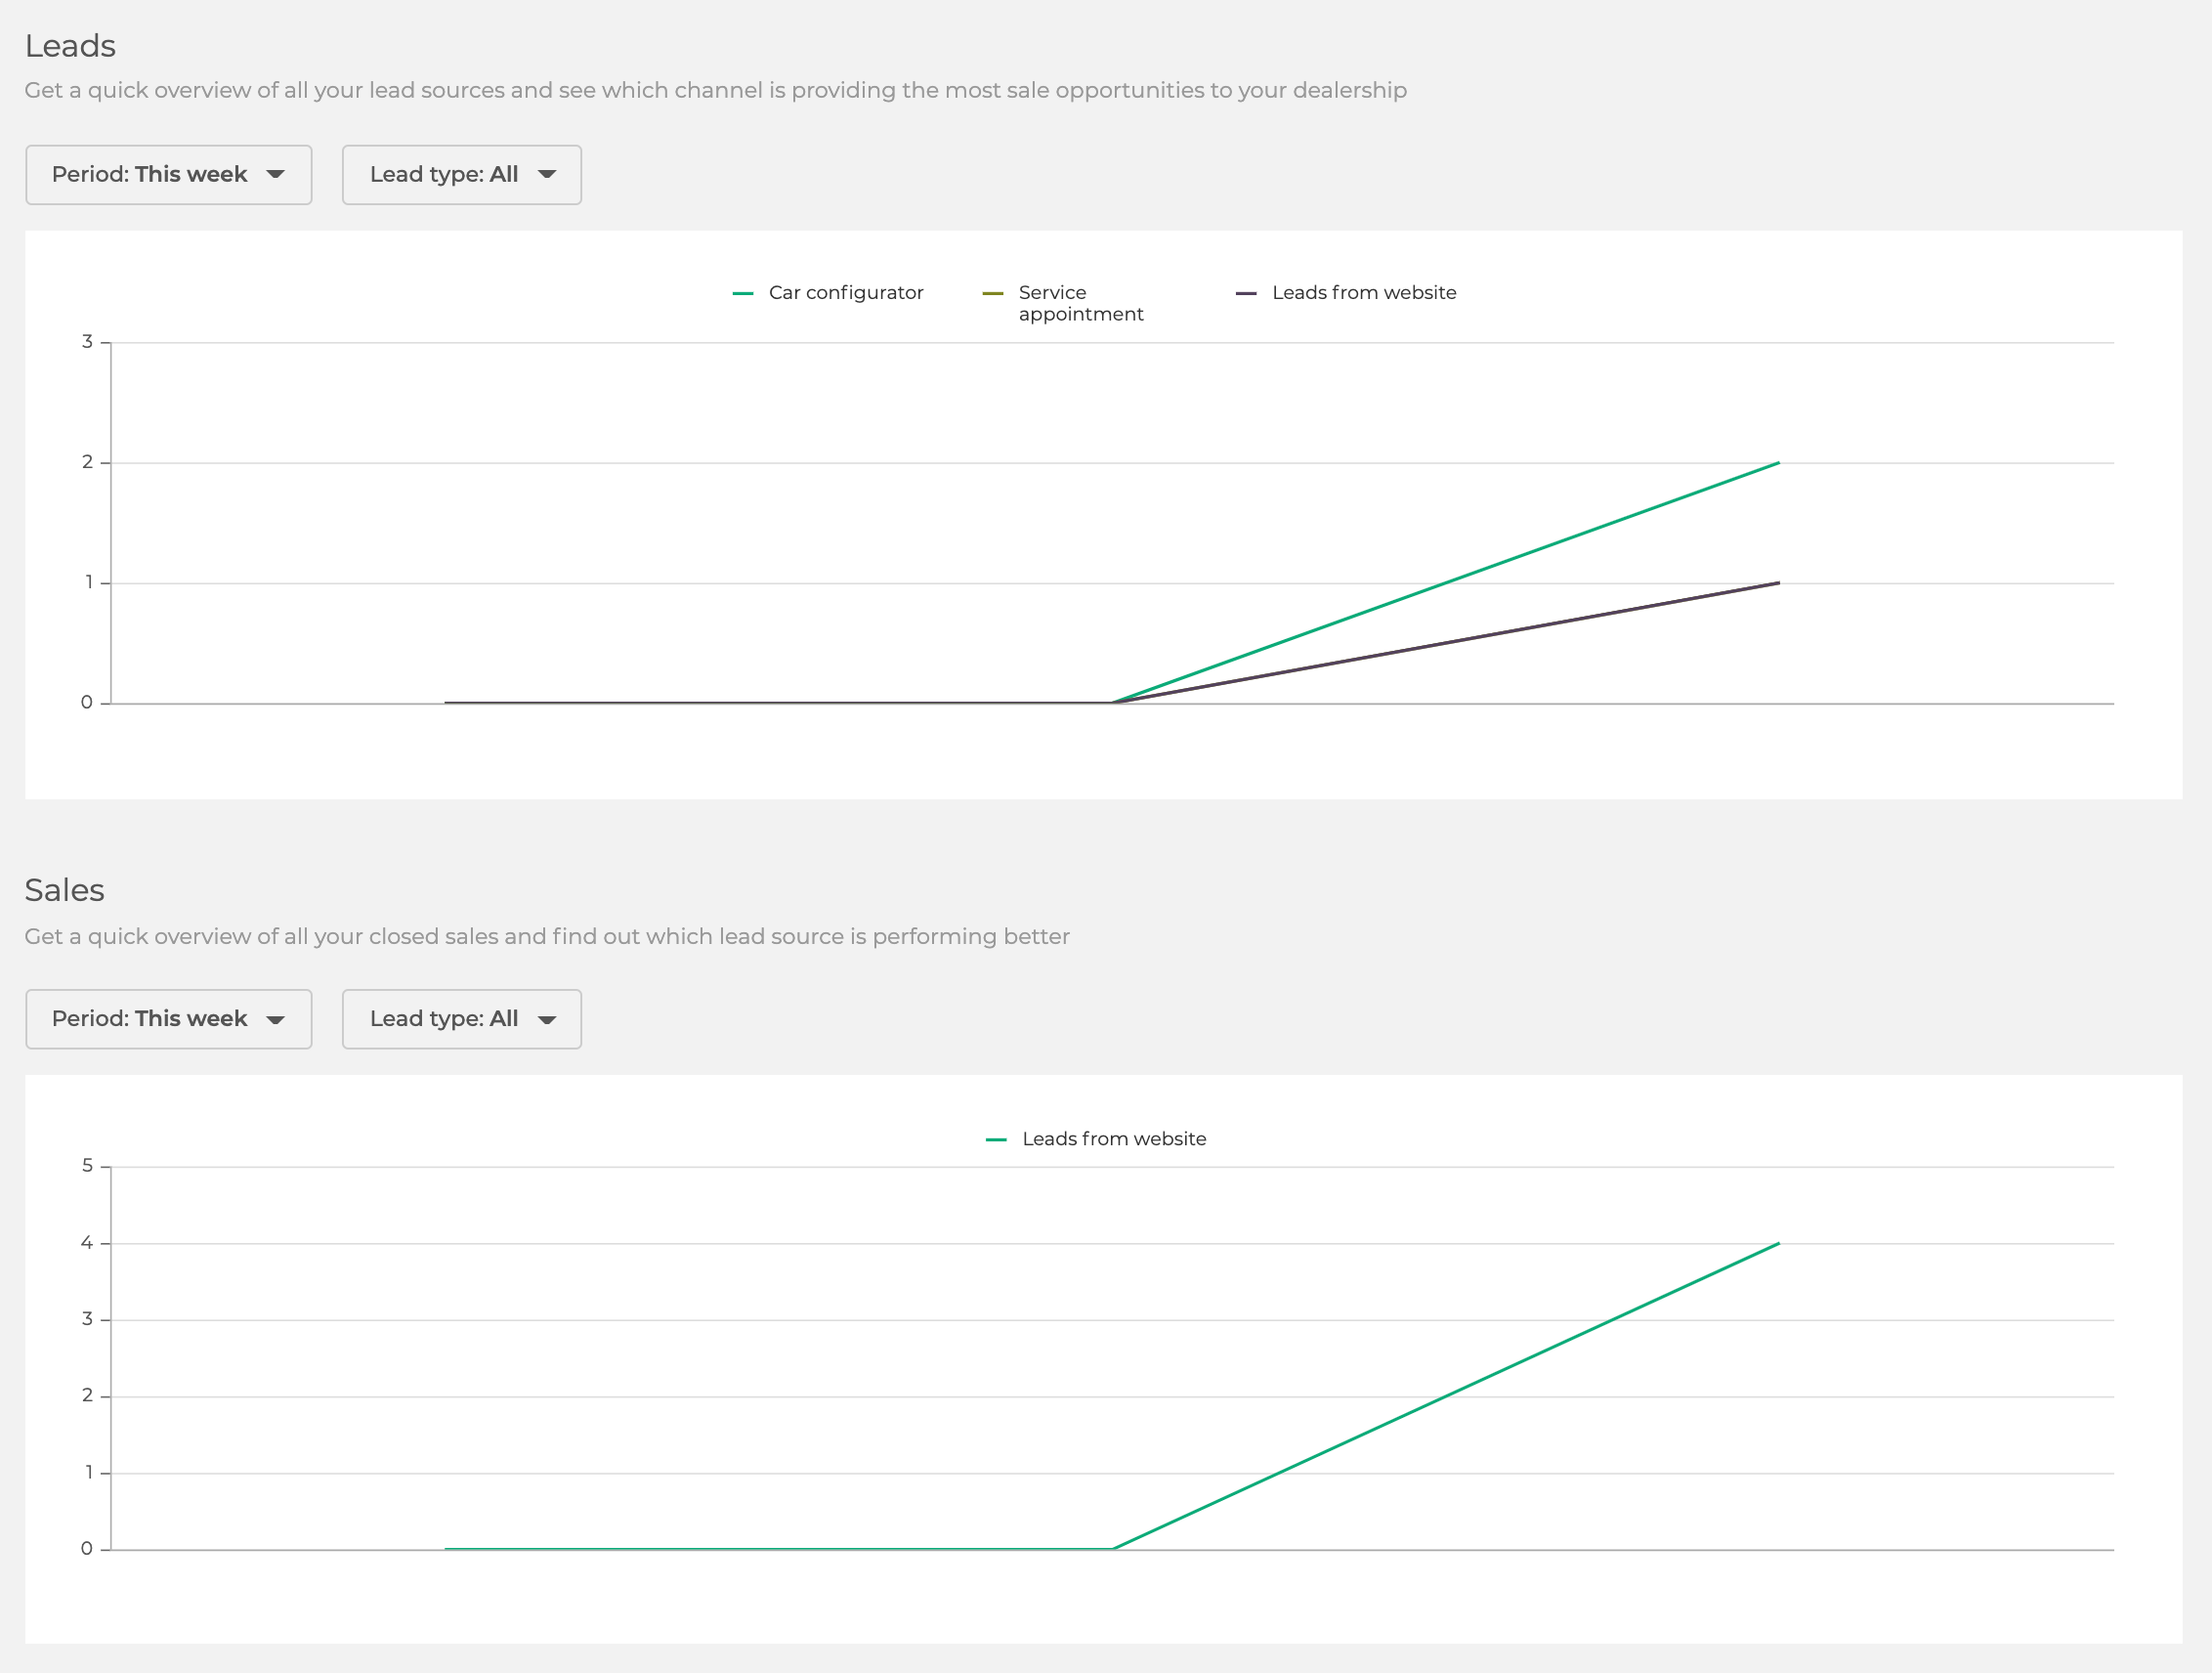
Further done on the same page, you can get a quick overview on which channel is providing the most leads, and which lead type is leading to most sales. You can filter by time period and lead type.
